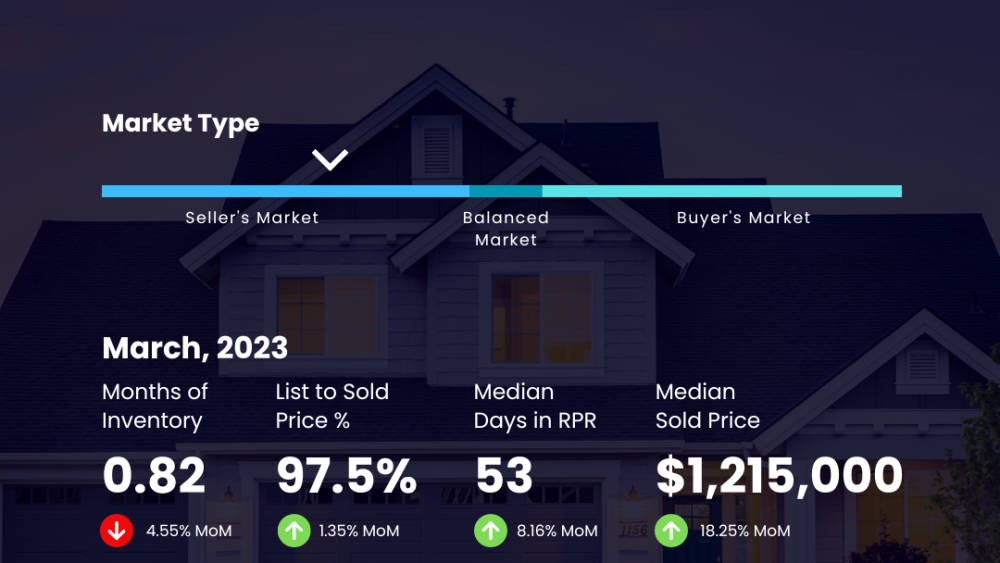
As a real estate professional, it is important to analyze various metrics to gain a comprehensive understanding of the market trends. In this particular scenario, the data reveals some interesting correlations that can provide valuable insights for both buyers and sellers.
Firstly, the Months Supply of Inventory is a key indicator of market conditions. With a low supply of 0.82 months, this suggests a strong seller’s market where demand exceeds supply. This is further supported by the median days homes are on the market, which is only 13 days. This indicates that homes are selling quickly due to high demand.
The 12-Month Change in Months of Inventory shows a significant decrease of -14.58%, indicating a trend towards even lower inventory levels. This can lead to increased competition among buyers, potentially driving up prices.
The List to Sold Price Percentage of 99.7% demonstrates that sellers are able to achieve close to their asking price, indicating a strong market where buyers are willing to pay top dollar for properties.
Lastly, the Median Sold Price of $335,500 reflects the current market value of homes in this area. This information can be useful for both buyers and sellers in setting realistic expectations and making informed decisions.
Overall, these metrics paint a picture of a competitive real estate market with high demand and limited inventory. Buyers may need to act quickly and be prepared to make strong offers, while sellers may benefit from maximizing their listing price. It is important for both parties to work with a knowledgeable real estate agent who can navigate these market conditions effectively.

